This page is a user guide for TFM-Explorer.
Table of contents
- Starting Form
- Main results page
- Detailed results page
- Cis-regulatory modules search page
- Pairwise correlations page
- General requirements
1 Starting Form
The starting point of TFM-Explorer is to provide the data you want to analyse. On this page, you have to enter a set of upstream regulatory sequences, to select weight matrices corresponding to putative transcription factor binding sites, and optionally to modify running parameters for TFM-Explorer.
1.1 Enter upstream sequences
Sequences can be specified in two ways: you can either give a list of RefSeq gene identifiers, or directly give sequences in FASTA format. In both case, the set of sequences should contain at least three sequences, and no more than 20 sequences if you expect to obtain good results. You can upload a file containing the data, or paste it in the typing area.
1.1.1 RefSeq access numbers
The first possibility is to give a list
of gene identifiers. Supported identifiers are RefSeq identifiers, of the form NM_XXXXXX. We recognize
all identifiers that are available from the UCSC genome Browser for the
following organisms: Human (hg19), mouse (mm9), rat (rn4),
Drosophila melanogaster (dm3), chicken (galGal3). Upstream sequences are
automatically retrieved from the corresponding genomic sequence for
the RefSeq identifier.
You should indicate one gene per
line. Lines that start with '#' are skipped. The header
line (> title or comment) is optional.
Examples:
     >Human target genes
     NM_000040
     NM_000043
     NM_000073
     NM_000074
     #this is a comment
     NM_000118
     NM_000201
     NM_000367
     ...
If you enter an unknown RefSeq access number, it will not be used in the search as we cannot retrieve its DNA sequence, and a warning will appear on the wait page. Note that for technical reasons (impossible to extract the DNA sequence) the following NM identifiers are not available:
		dm3:		galGal3:	rn4:		mm9:		hg19:
		NM_164313	NM_001031391	NM_133387	NM_020279	NR_001444
		NM_001042857	NM_204759	NM_001047936	NM_153523	NM_001075
		NM_001042856	NM_001017412	NM_001013125	NM_001031622	NM_022553
		NM_001110964	NM_001024582	NM_213561	NR_027974	NM_001144767
		NM_001015499	NM_001001302					NR_031742
		NM_141178	NM_001031380					NR_031738
		NM_001169365	NM_001006343
		NM_175941	NM_001044666
		NM_001032277	NM_001031367
		NM_001015260	NM_001031360
		NM_001015261	NM_001031366
		NM_001015262	NM_001031509
		NM_001015263	NR_031544
1.1.2 FASTA format
The other possibility is to provide a set of nucleic acids sequences for upstream regions in FASTA format. Sequence in FASTA format consists of a single-line description (the header) followed by lines of sequence data.
The header of each sequence must be in a strict format: The first character of the description line is a
greater-than ('>') symbol. Then it is followed by a
sequence identifier (sequence_id), whose format is free, and by the
name of a genome assembly corresponding to the organism (organism):
The assembly must be an assembly recognized by TFM-Explorer: hg19,mm9,rn4,dm3 or galGal3.
>sequence_id| organism.
This information is mandatory. Everything after the organism is ignored.
The sequence data is the nucleic acids sequence. Lower-case and
upper-case letters are both accepted. The full standard IUPAC nucleic
acid code is not supported: Only A, C, G, T, U and N symbols are
recognized. Numerical digits 0, ..., 9, - and dot . symbols are
accepted. They are simply ignored.
N symbols are considered as representing any nucleotide. The user should avoid using
sequences with long streches of N's, as they will match all transcription factor binding
profiles and produce false positive clusters.
Example:
	>mygene|hg19
	CCAAGATTATGCCACTGCACTGCAGCCTGGGCAAAAGAGTGAGACTGTCTCAAAAAAAAAAAAAACCTGTTTTGTTTTTC
	TTTTGGAGAAAAGGCATACAAATTTATTAGCATGCAGACTGGGAGAACCACAAGGTGATTATCCCTATTTTAAATTTTCT
	AATAAACATACTATTATTTATTTATTTATTTATTTATTTATTTATTTATTTATTTTTTGAGACGGAGTCTGGCTCTGTCG
	CCCAGGCTGGAGTGCAGTGGCGCGATCTCAGCTCACTGCAAGCTCCGCCTCCCGGGTTCACGCCATTCTCCTGCCTCATC
	CTCCCCAGCAGCTGGGACTACAGGCGTCCGCCACCACGCCCGGCTAATTTTTTTGTATTTTTAGTAGACACGGGGTTTCA
	.......
1.2 Enter location
In both cases (RefSeq identifiers or FASTA sequences), the set of sequences should be accompanied by the relative location of upstream sequences on the genomic sequence in regard of the Transcription Start Site. This location is common to all sequences.

Given the start and end positions of the region, it will be the same for all the input sequences. The default values are -2000:200 and can be changed, providing that the new values are between -10000 and 5000 around the TSS.
If you entered the sequences in FASTA
format, the size of the region must correspond to the length of
your sequences.
If a sequence is longer, it is automatically cut in
order to have the same length as others and only the 3' side of the
sequence is kept. Indeed, a key feature of TFM-Explorer is that the prediction
takes advantage of spatial conservation in regards of the
Transcription Start Site. When input sequences are given by
the user, we suppose that all sequences share a same position for the TSS. starting from
the 3'end of the sequence. This is the reason why we discard the 5' end.
On the other hand, if a sequence is shorter than
the size of the specified region, the location is changed to fit this
length: all the sequences are truncated.
1.3 Select transcription factor binding profiles
Putative transcription factor binding sites are modelled using weight matrices. We use matrices from 6.0 TRANSFAC (disclaimer) and 2009 Jaspar.
You should either select a complete database of matrices (2 first options), either select a set a matrices no matter the database (3rd option), or upload a file containing matrices identifiers from Transfac or Jaspar, with one identifier on each line of the file (4th option).
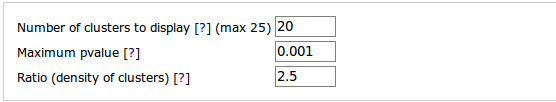
1.4 Adjust parameters (optional)
You can specify some parameters regarding the results of TFM-Explorer. Default values are a good choice in many cases.
Number of clusters to display. This is the number of selected clusters that are returned by the software. Clusters are sorted by increasing P-values. This value must range between 1 and 25. Default value is 25.
Maximum P-value. Another way to control the number of selected
clusters is to specify a P-value threshold. Only
clusters with a smaller P-value than the given value are returned.
P-value should be written in format x.xxx. Scientific and exponential formats are not accepted.
Ratio (density of clusters). This parameter value is used by
TFM-Explorer algorithm. It indicates the expected average density of
sites in a selected cluster relatively to the average number of sites
in the reference background model.
The higher the ratio is, the smaller the clusters are. The default value is 3.0, and the parameter ratio should be < 4.0 and > 1.2.
1.5 Start TFM-Explorer
Simply press the "Run TFM-Explorer" button. If, for reasons mentionned above, some sequences were cutted or discarded, a warning message appears on the waiting page to inform the user.
2 Main results page
On this page are presented the top clusters found by TFM-Explorer. Each cluster is characterized by a region on the genomic sequences and a weight matrix: The region shows a local overrepresentation of transcription factor binding sites for the associated matrix. The clusters are classified by increasing P-value.
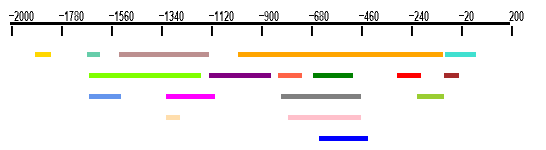
2.1 Spatial representation of clusters
This drawing shows the relative positions of all clusters on the
whole scanned region. The scanned region is represented by an horizontal black line. Each
cluster is represented by a colored line. Colors of the lines are for the weight matrices.
You can click on each colored line to access a detail page. Results
are also displayed in further detail in the results table.
2.2 The results table
This table is the list of the top clusters found by TFM-Explorer. For each cluster the information given is:
- Rank: The clusters are sorted by increasing P-value.
- Factor: The name of the transcription factor associated to the overrepresented binding sites in the cluster.
- Matrix ID: The identifier of the weight matrix corresponding to the transcription factor.
- Location: The boundaries of the cluster regarding the Transcription Start Site.
- Sequences: The number of input sequences having at least a putative binding site for the weight matrix in the cluster.
- P-value: The P-value of the cluster.
- Correlated with: A link towards a detailed list of correlations between this cluster and the other ones.
- Legend: A color given to the transcription factor of the cluster and used in the visualization tools.
Each line can be clicked and leads to another page with more detailed information. You can also select an arbitrary number of clusters (last column of the table), and visualize all transcription factor binding sites for these clusters.
2.3 View transcription factor binding sites for selected clusters
Here is a link towards a page that allows you to visualize the transcription factor binding sites of the clusters you selected in the results table, and to search for cis-regulatory modules in the results outputted by TFM-Explorer.
This functionality is described in further details in Section 4.
2.4 Summary of pairwise correlations between clusters
This table shows all pairwise correlations between all the clusters. The clusters are organized by increasing position in the scanned region.
The colors are linked with the correlation coefficient and a click on a correlation redirects towards a detailed page.
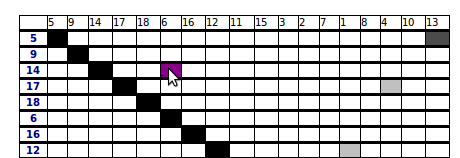
The meaning and formal definition of pairwise correlation are described in further detail in Section 5.
2.5 Download result files
Using the complete results download, you can download three files that are created by TFM-Explorer:
- hits.csv: A CSV file that contains all the hits of the matrices on the input sequences found by TFME.
- correlations.csv: A CSV file that contains all the pairwise correlations between the extracted clusters
- windows.xml: An XML file that contains detailed information about the extracted clusters and the job
CVS files can be opened with any spreadsheet software, such as Excel.
These files can be useful if you wish to develop your own tools to analyse the results of TFM-Explorer but are not easy to read for a human.
The summary result file is a simple text file with a summary of the result clusters and their information.
3 Detailed results page
This page presents the detailed information for a given cluster, as well as some useful tools to investigate it.
3.1 General information
Average GC% for the sequences: This is the GC percent of all input sequences in the region of the considered cluster.
Average GC% for the weight matrix: This value is computed from the weight matrix associated to the cluster. It gives the GC percent of sequences used to build the weight matrix.
Sequence logo: Sequence logos are a graphical representation of
weight matrices for a set of binding sites.
It provides a rich and precise description.
![]()
Each logo consists of stacks of nucleotides,
one stack for each position in the matrix.
The overall height of the stack indicates the sequence conservation at that position,
while the height of symbols within the stack indicates the relative frequency of each nucleic acid at that position.
See http://weblogo.berkeley.edu/ for more information.
3.2 Visualization of putative transcription factor binding sites
By default, this drawing shows all transcription factor binding sites for the weight matrix of the current cluster, in the region delineated by the cluster boundaries.
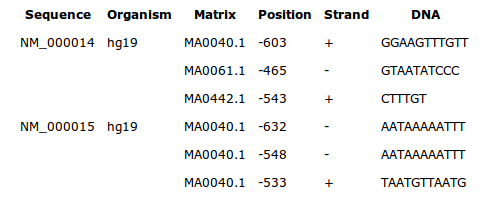
Each sites is symbolized by a small rectangle. Sites found on the positive strand of the sequence are displayed above the line of the sequence. Sites on the negative strand are displayed under the line (see figure below).
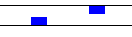
The size of the rectangles has nothing to do with the real length of a site, it is the start position that is correctly placed on the sequence.
A legend goes with the drawings to recognize the color of the sites
belonging to a weight matrix.
The list of all binding site sequences is displayed under the drawing.
Note that you can modify this drawing and enrich it in several ways.
- You can add weight matrices. The weight matrices are presented in two boxes: The first one contains the weight matrices that have been selected in top clusters, and the second one contains all the other matrices.
- You can modify the boundaries of the region, and specify relations between sites by defining cis-regulatory modules. This is done by modifying values in the box Cis-regulatory modules parameters. Cis-regulatory modules are described in further details in Section 4.
4 Cis-regulatory modules search page
In TFM-Explorer, a module is defined as a combination of transcription factor binding sites for a selection of weight matrices, no matter their order or the pairwise distance between them. Only the maximal length of the module and the minimal numbers of selected weight matrices present in a module are specified.
Available weight matrices are presented in two boxes. The first one contains the weight matrices that have been outputted as main matrices for the resulted clusters, and the second one contains all the other matrices. Use the checkbox lists to select which weight matrices you want to search for. In the third frame, you have to specify some parameters concerning the specification of the module.
- Maximal length of a module: The maximal number of positions between the first and the last element of the module.
- Minimum position: The position on the sequence where the search for module should start.
- Maximum position: The position on the sequence where the search for module should end.
- Minimal number of distinct matrices in a module: The quota of different factors that should be in a module. This number should be smaller than or equal to the number of selected weight matrices.
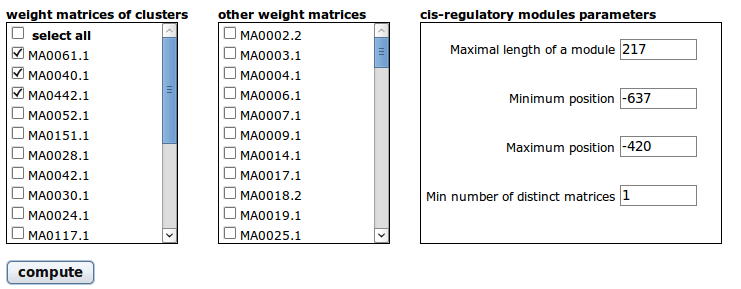
Some parameters may be prefilled. As you access this page from the main results page after having selected top clusters, the first and last positions are the start and end position of TFM-Explorer scan and the length of a module is the whole scanned region. The number of distinct factors is 1.
Once you have filled in the form or changed the parameters, press the "compute" button. The drawing is automatically updated.
5 Pairwise correlations page
Pairwise correlations calculations are conducted between all clusters found by TFM-Explorer. This page shows the details of the correlations between a given cluster and all other clusters.
The calculation is based on the
subset of input sequences associated to each cluster. Assume the set
of input sequences given by the users contains n sequences. Then
each cluster can be assigned a binary vector of size n as follows:
the ith element of the vector is 1 if the ith input sequence
contains an occurrence for the weight matrix and the region of the cluster,
otherwise it is 0.
Two clusters are considered as correlated as soon
as their respective binary vectors are not randomly distributed. The
value of the correlation coefficient ranges between -1 and 1. The higher the absolute value is,
the higher the correlation between the two clusters is.
Positive
values indicate that the clusters share more sequences than expected
by chance. This corresponds for example to transcription factors that act
synergistically.
Negative values indicate that the clusters share
lesser sequences than expected by chance. In this case, clusters
correspond to two complementary subsets of sequences showing different
regulatory mechanisms.
Sequences logo of the transcription factor of each cluster are
presented and can be downloaded.
When clicking on More detail, you access a new page with the details of the selected correlation.
On this page you can visualize for the two clusters all the
corresponding transcription factor binding sites for all sequences.
6 General requirement
You have to enable Javascript on your browser to use all visualization tools.